Menu
Data Visualization and Infographic Design
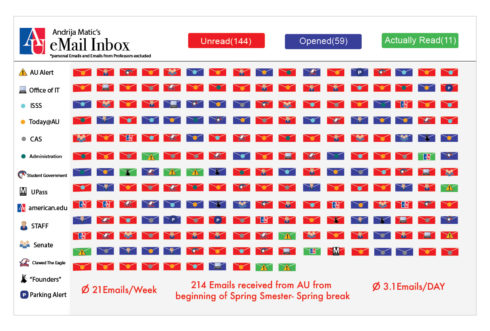
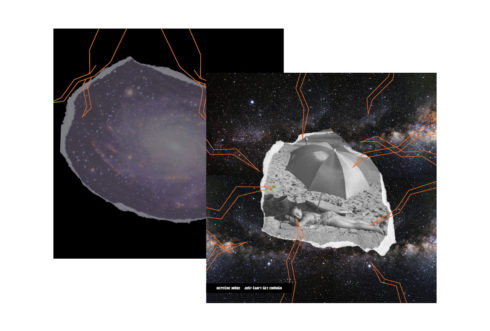
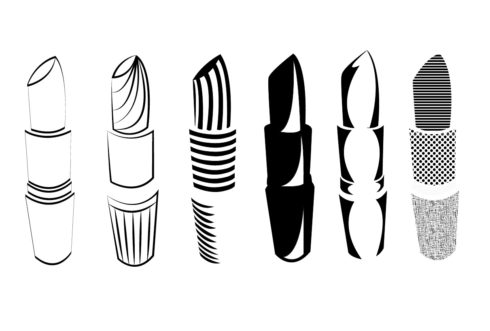
Students gather data on their day-to-day lives: places visited, modes of transportation, exercise, purchases, time allotment, foods, sleep, social interactions…. By representing the data in experimental and unexpected ways they convey a narrative about themselves.
programs taught & used Adobe Illustrator